

Developing ESP32 code by iteratively downloading code to your target via esptool can become laborious for anything but the smallest of projects.
In addition to the UART Bootloader, the ESP32 can also be programmed and debugged via the JTAG interface. Debugging allows single stepping through your code, adding breakpoints and examining the contents of registers.
Besides the rich debugging, programming over JTAG can also speed up development as the JTAG interface can be as fast as 20MHz as opposed to the serial download at a typical 460,800 bps.
Setup
This tutorial assumes you have Eclipse and the esp-idf set-up on Ubuntu 20.04.01 LTS. If not, please visit Getting started with the Espressif esp-idf & Eclipse IDE
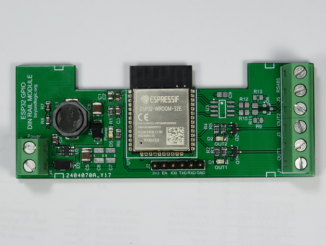
It also assumes you are using an FTDI based JTAG interface such as the Espressif ESP-Prog.
Running OpenOCD as a normal user will probably result with the following error message:
Error: libusb_open() failed with LIBUSB_ERROR_ACCESS
To prevent this occurring, create the file /etc/udev/rules.d/99-openocd.rules and add the following contents:
# Copy this file to /etc/udev/rules.d/

ACTION!="add|change", GOTO="openocd_rules_end"
SUBSYSTEM!="usb|tty|hidraw", GOTO="openocd_rules_end"

# Please keep this list sorted by VID:PID

# Original FT232/FT245 VID:PID
ATTRS{idVendor}=="0403", ATTRS{idProduct}=="6001", MODE="664", GROUP="plugdev"

# Original FT2232 VID:PID
ATTRS{idVendor}=="0403", ATTRS{idProduct}=="6010", MODE="664", GROUP="plugdev"

# Original FT4232 VID:PID
ATTRS{idVendor}=="0403", ATTRS{idProduct}=="6011", MODE="664", GROUP="plugdev"

# Original FT232H VID:PID
ATTRS{idVendor}=="0403", ATTRS{idProduct}=="6014", MODE="664", GROUP="plugdev"

LABEL="openocd_rules_end"
Then restart udev using:
#sudo udevadm trigger
You will also want to be a member of the plugdev group. By default, Ubuntu users are normally members of the plugdev group and hence no action is required.
Update OpenOCD-esp32
OpenOCD-esp32 should already be installed in your home directory at ~/.espressif/tools/openocd-esp32/
However we are noticing regular updates and bug fixes with OpenOCD-esp32. Release information detailing features and bug fixes can be found at https://github.com/espressif/openocd-esp32/releases
If you don’t have the latest version of OpenOCD, download and extract a copy:
cd ~/.espressif/tools/openocd-esp32/
mkdir v0.10.0-esp32-20200709
cd v0.10.0-esp32-20200709
wget https://github.com/espressif/openocd-esp32/releases/download/v0.10.0-esp32-20200709/openocd-esp32-linux64-0.10.0-esp32-20200709.tar.gz
tar -xzf openocd-esp32-linux64-0.10.0-esp32-20200709.tar.gz
Once downloaded, the new version needs to be specified in Eclipse. Within Eclipse, from the Window Menu, select Preferences:
In the left hand panel , under Espressif, select Global OpenOCD Path:
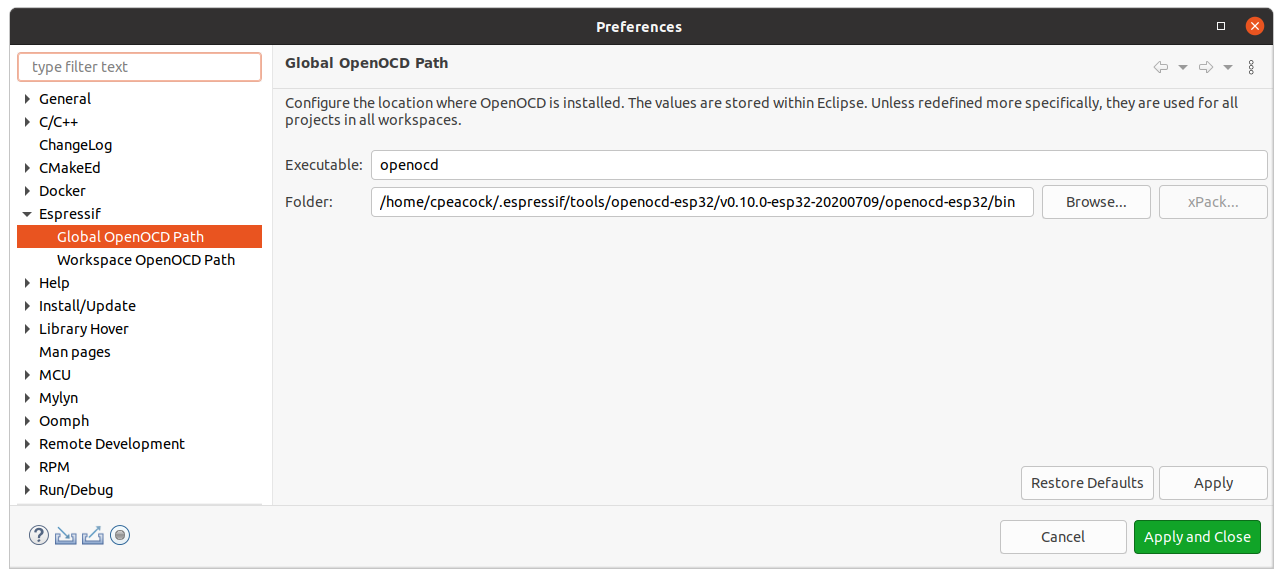
Change the path to reflect your new version and click Apply and Close.
Debugging Configurations in Eclipse
First, open/import an ESP-IDF project. For this example we use
esp-idf/examples/get-started/blink
(If no project is open, you may get a java.lang.NullPointerException error.)
Second, build your project so a binary file exists in the build directory.
From the run menu, select debug configurations
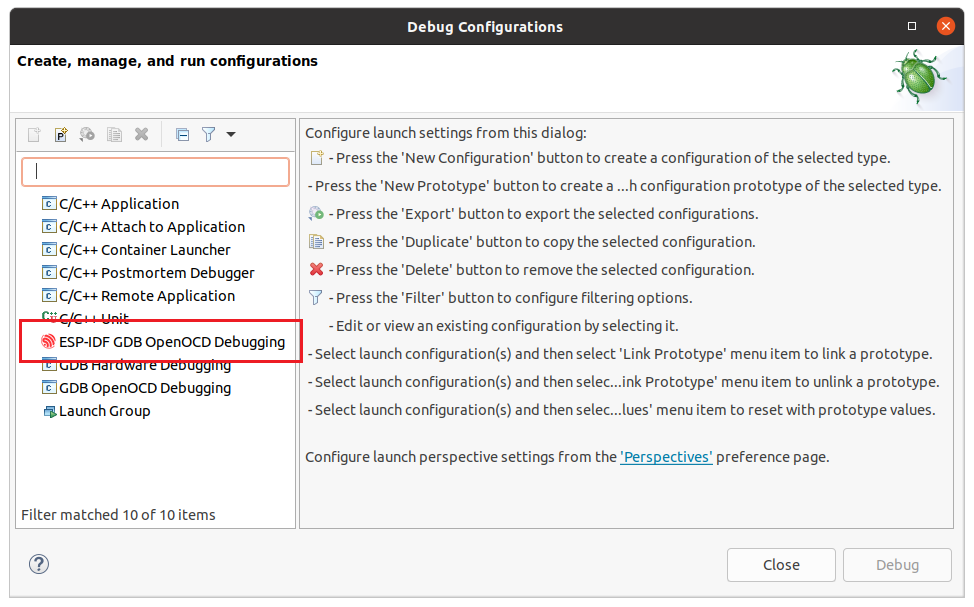
Right click on ESP-IDF GDB OpenOCD Debugging and select New Configuration.
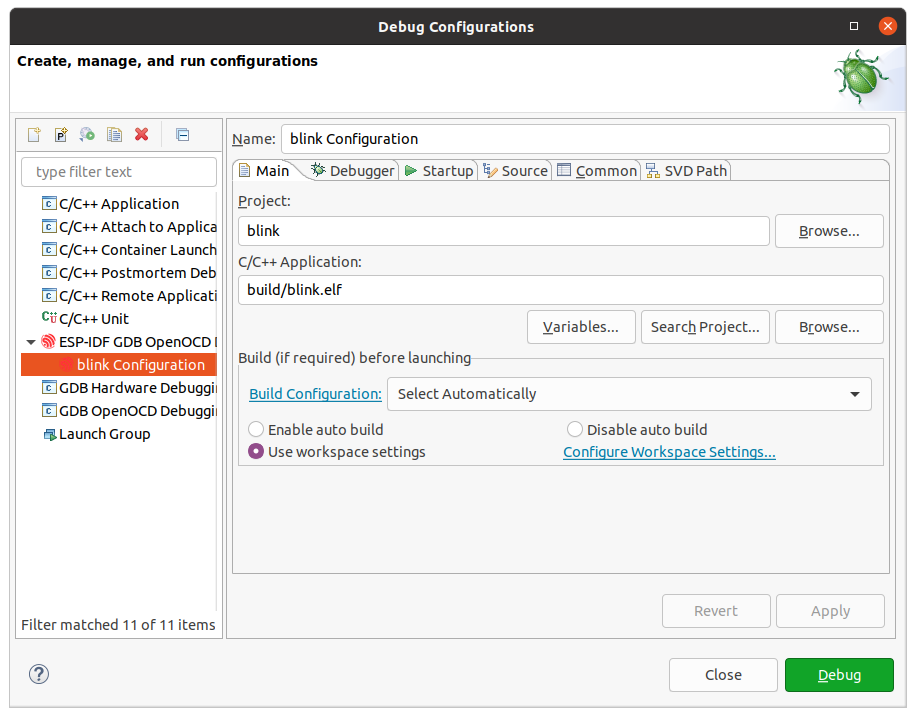
The settings on the Main tab should look like below and should not need amending.
Next, click on the Debugger Tab:
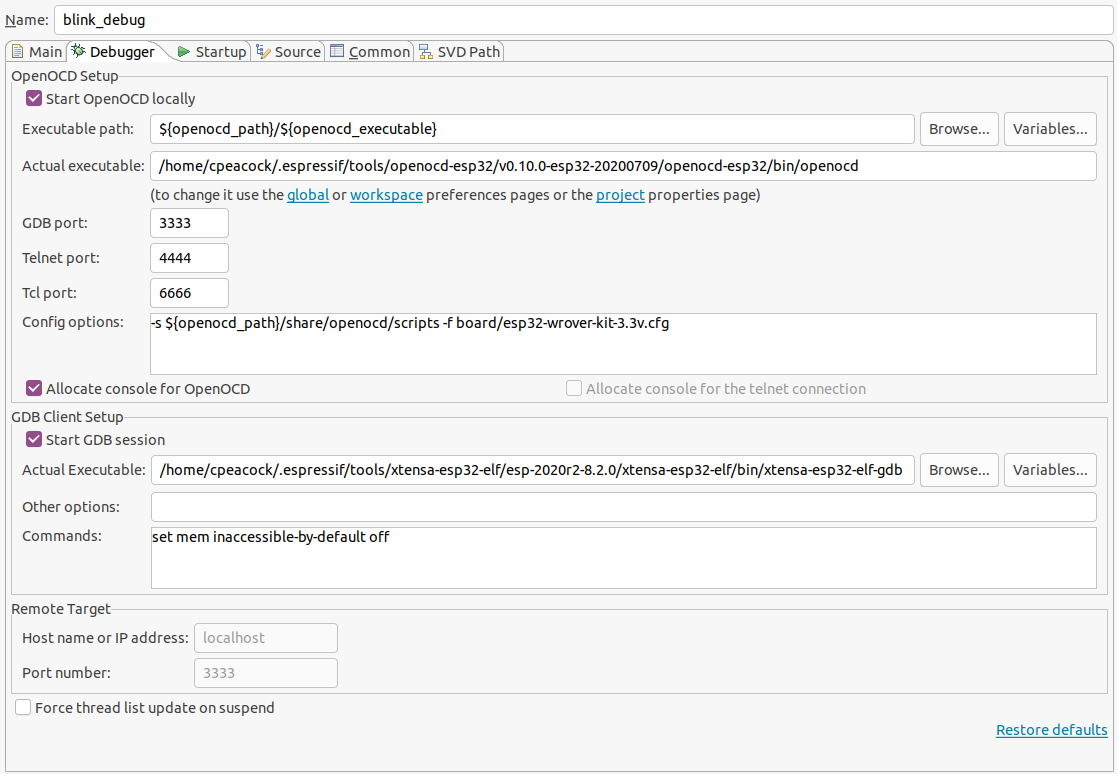
Change the Config options to
-s ${openocd_path}/share/openocd/scripts -f interface/ftdi/esp32_devkitj_v1.cfg -f board/esp32-wrover-kit-3.3v.cfg
Now click on the Startup Tab:
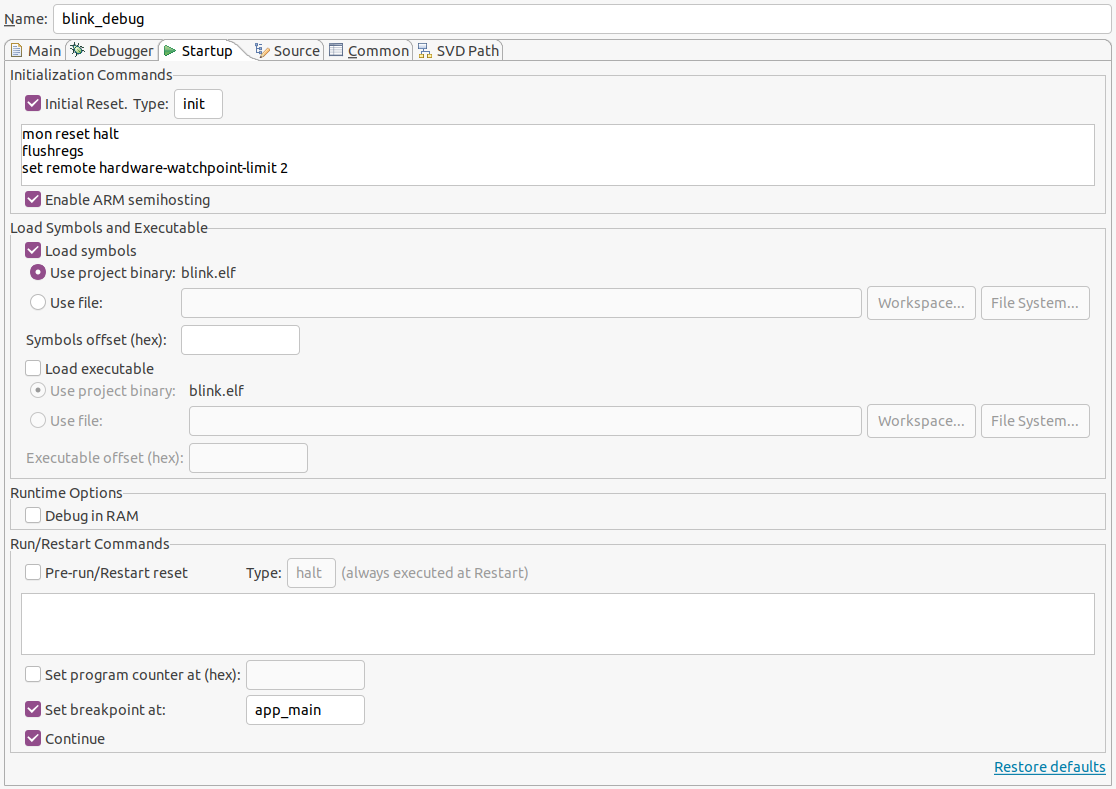
The default debugging configuration assumes you have already downloaded your source code to the target and you are attaching the debugger to a programmed target.
If you want to download the code first, which is typical in a iterative programming development cycle, add the following to the top of you Initialization Commands:
mon program_esp ${workspace_loc:blink/build/blink.bin} 0x10000 verify
This will download your code over the JTAG link prior to establishing the debugging session.
Debugging
Expressif has a great document on debugging within Eclipse: https://docs.espressif.com/projects/esp-idf/en/latest/esp32/api-guides/jtag-debugging/debugging-examples.html
Potential Errors
Below are some potential errors you may face with openocd and esp32-gdb.
xtensa-esp32-elf-gdb requires shared library libpython2.7.so.1.0
Error: Could not determine GDB version after sending: …/esp-2020r2-8.2.0/xtensa-esp32-elf/bin/etensa-esp32-elf-gdb –version, response:
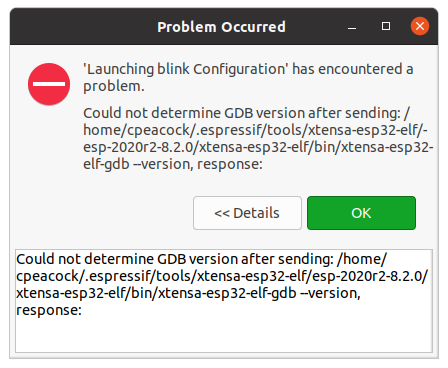
If you receive this error and try to run xtensa-esp32-elf-gdb on the command line, you are likely to get the following error suggesting a library is missing:
xtensa-esp32-elf-gdb: error while loading shared libraries: libpython2.7.so.1.0: cannot open shared object file: No such file or directory
GDB (8.1.0.20180627) is currently built with Python 2.7 libraries. You will need to manually install these:
sudo apt-get install libpython2.7-dev
Expressif developers indicate they plan to switch to building GDB with Python 3 libraries in the next toolchain release.
When all else fails…
Expressif has comprehensive documentation at JTAG Debugging
Hi. I get the error ” Error in services launch sequence
Starting OpenOCD timed out. ”
When I try launching from the command line, the gdb connection drops. What should I do?
Hi Craig, thank you for publishing this article. Just what I needed! In MS Windows 11 /WSL2/Ubuntu 20.04 I am trying to learn how to debug using an ESP-PROG device with an ESP32-S2-Saola-1R. Inside a VSCode session, in a terminal window, when trying to run openocd it reported the ‘libusb_open() error’ as described in this article under ‘Setup’. I copied the udev rules example shown there. As far as my knowledge goes, I think that in the end of the example of the file ‘file /etc/udev/rules.d/99-openocd.rules’ is missing a line stating: ‘LABEL=’openocd_rules_end’.
Paul, Thanks for your comments. Yes, you are right – I’ve just added the missing line.